#SQL time series
Explore tagged Tumblr posts
Visit Tumblr Blog
Explore Tumblr blogs with no restrictions, modern design and the best experience.
Last Seen Tumblr Blogs


Fun Fact
Tumblr has a low social media market share in South America.
Text
A few years ago I did a full-length version of this tag, which I thought would be a fun thing to revisit for this NYE! (You should do this too, if you feel so inclined! count this as me tagging you.)
share your favorite memory of this year.
I can't really tell you anything but multiple flashes that I hold close to my heart-- my mother sitting up in bed laughing over something I said about my brother, my whole family dancing at my brother's wedding hand-in-hand, one of my friends saying wistfully it was so good to hear me & my teammate's voices on the phone, me driving home the first evening it felt like fall and watching the leaves swirl around the street, me seeing a tiger (!!!) in the spring. A beautiful year, if a hard one!
2. what was the highlight of your year?
Most likely my brother's wedding! It tinged the year in such a golden light.
3. list the top five books you read this year.
In no particular order (except for the Q love u Q), The Q, The Carrying, The Miraculous Journey of Edward Tulane, The Sound of a Wild Snail Eating, and the entire Frieren series tbh.
4. list the top five movies you watched this year.
Past Lives (movie of my HEART), Twisters, Miss Potter (my first rewatch since childhood and 😭😭), The Fall Guy, and tbh Return to Me (I think of it often!)
5. list the top five tv series you binged this year.
Hmmmm....this is always difficult! I would say, Abbott Elementary (my beloved), Psych (extra points for watching with my brother), Summer Strike (peaceful show of my heart), ??????, I rewatched Makanai which I love dearly but I swear I cannot remember off the top of my head anything else I watched, liked, and finished.
6. what is the one new thing you discovered this year (could be a place/hobby/song etc)?
I started learning SQL and that somehow to me was such a joy! And after reading The Hurting Kind book Ada Limón finally got into my heart for realsies this time and I think that's magical.
7. top three albums that you played this year?
I think I'm going to do a ranking on all their own, but peeeeersonally I think the albums that most were There for me were Charm by Clairo, Vertigo by Griff, Positive Spin by Gretta Ray. (Honorable mention to TTPD that has been with me through it all, it just feels too vast for me to really put a pin in it for just this year, you know?)
8. your spotify wrapped #1 song
These Walls – Dua Lipa, which I don't fully know what to say about it except that the shiny sparkly sound somehow makes me feel so bright and emotional at the same time.
9. your spotify wrapped top artist
Taylor forever.
10. your personal song of the year.
It's not even from this year! But You've Already Won by Gretta Ray song of all time to ME. It can simply hold a whole life in its hand and I love that so. Also a little shoutout to Down Bad which can still make me cry 8 months 10,000 listens later.
11. what is an achievement that you are proud of this year?
not necessarily any singular achievements. I'm proud of how much time I've spent with my mom, I think. I'm proud of how much I've grown in regards of my work. It's been a year of quiet (if grueling) growth and I'm proud of that.
12. what are your goals for the next year?
My goals? I think mostly that I'm setting some writing goals (daily journaling, quarterly chapbooks, 20k of a book draft) and I want to pick up boxing again as I've let it lapse this month.
13. any three book releases you are excited for next year.
I'm soooo out of the loop here, alas. There's new Maggie Stiefvater that I will read, there's new Emily Henry I will probably read.
14. any three upcoming movies/tv series that you are excited for next year.
tentatively excited for new Superman, tentatively excited for second half of Wicked, always excited for more Abbott Elementary.
15. if you could change one thing about the past year what would it be?
very little! I had to go through it to come out of the other side of it. (And when it shines out it'll shine all the clearer or something of the sort.)
16. did you manage to stick to your new year’s resolutions this year?
Not even a little! I was going to use this year to try to draw something every day, which I failed horribly at, but I think that's only to be expected. Still, I want to use my resolutions to create more little spaces of FUN in my life again. I've missed them horribly.
17. do you have any new year’s resolutions for the next year?
My only real, true type of resolution is simply to have FUN. While I've still had lots of big, beautiful joys this year, I've not delighted as I ought to, and I want to bring that part of myself back. Learn some new dances, learn to make sourdough, things along that line. Just get back into the motions of living and find myself swept up by the verve of it all. That's my one bit of resolve.
18. favorite meme of the year?
I could not tell you the name of a meme right now if you told me my life depended upon it. I love the bit we have of using substitutes because we don't do suicidal ideation anymore here babes. I love the resurgence of the children's hospital red meme.
19. which month was the most fun this year?
The most fun?! I mean, probably...October? It's hard to tell because there were challenges in so many! But I laughed the most in October so it must be then.
20. if you could tell yourself something at the beginning of this year based on what you know right now, what would it be?
I mean...I think more than anything I'd just want to reassure myself of the past that it's really, really okay, and you have more strength and power within you than you might think. Also, even though it sucks and it's uphill work, if you want this to be a place full of love you have to be the one to put it there, you can't just luck your way into it, you yourself have to put your heart on the line and become love itself to the people you're given to care for. And that's something wonderful to take part in!
21. favorite viral trend of the year?
I looooove the international Mikus with ALL my heart. They're what make life worth living 💛💛
22. list any three new things you learned this year (could be recipes, a new skill, etc.)
This is the hardest thing for me to recall. I learned how to make arrozcaldo at last? And I started learning SQL as I said. I started properly, FINALLY learning the different forms of poetry at the beginning of the year (I know, I know, I'm shamefully self-taught) but a lot of it has fallen out of my brain. I need to set it more in my bones, I think.
23. how would you describe your year in a word?
Enduring, is a good one I think. It's been quite a year for gritting my teeth and bearing it, alas. But it's also been a year of fruitful, beautiful friendship and fellowship, a year of becoming greater company to myself and to others. Luminous would be another fitting word, actually! There's been a lot of beauty and grace granted to me, and I am very, very grateful. There's something bittersweet in leaving behind any year, and this year just as much as any! I'll never live it again. But I can live a new one, and that's just as magical in its own right. I hope I'm brave enough to meet it!
13 notes
·
View notes
Text
is there a way to solve this sql issue. I've run into it a few times and I wish i had a way to future-proof my queries.
we have a few tables for data that is somewhat universal on our site. for example file_attachments. you can attach files to almost every internal page on our site. file_attachments has an id column for each attachment's unique ID number, but attachee_id is used to join this table on anything.
the problem is, our system uses the same series of numbers for various of IDs. 123456 can (and is) an ID for items, purchase orders, sales orders, customers, quotes, etc. so to correctly join file_attachments to the items table, i need to join file_attachments.attachee_id to items.id and then filter file_attachments.attachment_type = 'item'. attachment_types do NOT have their own series of id numbers. i have to filter this column using words. then, sometimes our dev team decides to change our terminology which breaks all my queries. they sometimes do this accidentally by adding extra spaces before, after, or between words. though TRIM can generally resolve that.
is there anything I might be able to do to avoid filtering with words?
i was thinking about doing something to identify the rows for the first instance of each attachment_type and then assign row numbers to the results (sorted by file_attachments.id), thus creating permanent IDs i can use regardless of whether anyone alters the names used for attachment_type, or eventually adds new types. but idk if this is a regular issue with databases and whether there's a generally accepted way to deal with it.
8 notes
·
View notes
Text
Python Libraries to Learn Before Tackling Data Analysis
To tackle data analysis effectively in Python, it's crucial to become familiar with several libraries that streamline the process of data manipulation, exploration, and visualization. Here's a breakdown of the essential libraries:
1. NumPy
- Purpose: Numerical computing.
- Why Learn It: NumPy provides support for large multi-dimensional arrays and matrices, along with a collection of mathematical functions to operate on these arrays efficiently.
- Key Features:
- Fast array processing.
- Mathematical operations on arrays (e.g., sum, mean, standard deviation).
- Linear algebra operations.
2. Pandas
- Purpose: Data manipulation and analysis.
- Why Learn It: Pandas offers data structures like DataFrames, making it easier to handle and analyze structured data.
- Key Features:
- Reading/writing data from CSV, Excel, SQL databases, and more.
- Handling missing data.
- Powerful group-by operations.
- Data filtering and transformation.
3. Matplotlib
- Purpose: Data visualization.
- Why Learn It: Matplotlib is one of the most widely used plotting libraries in Python, allowing for a wide range of static, animated, and interactive plots.
- Key Features:
- Line plots, bar charts, histograms, scatter plots.
- Customizable charts (labels, colors, legends).
- Integration with Pandas for quick plotting.
4. Seaborn
- Purpose: Statistical data visualization.
- Why Learn It: Built on top of Matplotlib, Seaborn simplifies the creation of attractive and informative statistical graphics.
- Key Features:
- High-level interface for drawing attractive statistical graphics.
- Easier to use for complex visualizations like heatmaps, pair plots, etc.
- Visualizations based on categorical data.
5. SciPy
- Purpose: Scientific and technical computing.
- Why Learn It: SciPy builds on NumPy and provides additional functionality for complex mathematical operations and scientific computing.
- Key Features:
- Optimized algorithms for numerical integration, optimization, and more.
- Statistics, signal processing, and linear algebra modules.
6. Scikit-learn
- Purpose: Machine learning and statistical modeling.
- Why Learn It: Scikit-learn provides simple and efficient tools for data mining, analysis, and machine learning.
- Key Features:
- Classification, regression, and clustering algorithms.
- Dimensionality reduction, model selection, and preprocessing utilities.
7. Statsmodels
- Purpose: Statistical analysis.
- Why Learn It: Statsmodels allows users to explore data, estimate statistical models, and perform tests.
- Key Features:
- Linear regression, logistic regression, time series analysis.
- Statistical tests and models for descriptive statistics.
8. Plotly
- Purpose: Interactive data visualization.
- Why Learn It: Plotly allows for the creation of interactive and web-based visualizations, making it ideal for dashboards and presentations.
- Key Features:
- Interactive plots like scatter, line, bar, and 3D plots.
- Easy integration with web frameworks.
- Dashboards and web applications with Dash.
9. TensorFlow/PyTorch (Optional)
- Purpose: Machine learning and deep learning.
- Why Learn It: If your data analysis involves machine learning, these libraries will help in building, training, and deploying deep learning models.
- Key Features:
- Tensor processing and automatic differentiation.
- Building neural networks.
10. Dask (Optional)
- Purpose: Parallel computing for data analysis.
- Why Learn It: Dask enables scalable data manipulation by parallelizing Pandas operations, making it ideal for big datasets.
- Key Features:
- Works with NumPy, Pandas, and Scikit-learn.
- Handles large data and parallel computations easily.
Focusing on NumPy, Pandas, Matplotlib, and Seaborn will set a strong foundation for basic data analysis.
7 notes
·
View notes
Text

This year I take part in the "Mononoke Fan Zine". Here is the spoiler :3 Mononoke series is one of my favourite anime, which I watched several times and every time discovered smth new about it. I love everything about it: the plot, the character design, the style of the drawing and animation, the music and the actors' voices. It's a masterpiece! This year they started the SQL. I haven't chance to watch it yet, but I believe I won't be disappointed.
#fanart#mononoke series#Mononoke#illustration#fan zine#illustration spoiler#Mononoke SQL#anime#manga#anime fanart#anime fanzine#umibozu
14 notes
·
View notes
Text
The Hidden Growth Gaps in Most Lead Generation Agencies (and How to Fix Them Fast)
"You’re investing time, budget, and tech into lead generation — but somehow, the pipeline is dry, conversion rates are low, and your clients are restless. Sound familiar?"
If you’re running or working with a Lead Generation Agency, chances are you’ve faced the frustration of seeing high volume but low-quality leads. Or worse — leads that never convert. It’s not that you’re doing anything wrong. The problem is subtler: there are hidden bottlenecks, outdated tactics, and misaligned strategies that quietly drain performance.
In this blog, we’re going to break down exactly where most lead generation agencies go wrong, how to identify those invisible gaps, and—most importantly—what to do about them. Whether you’re scaling, struggling, or just ready to sharpen your edge, this post will walk you through clear, actionable strategies to optimize every stage of your lead generation engine.
Let’s uncover the fixes that actually move the needle.
1. Misaligned ICPs: Why Your Ideal Customer Profile Isn’t So Ideal Anymore
Keyword used: Lead Generation Agency
When agencies rely on outdated or vague Ideal Customer Profiles (ICPs), they waste resources targeting the wrong audiences. In today’s market, buyer behaviors evolve rapidly. What worked six months ago may not cut it today.
🧠 Common Signs of ICP Misalignment:
High lead volume but low conversion rate
Reps complaining that leads “aren’t ready to buy”
MQLs turning cold in the sales funnel
✅ Fix It:
Interview existing high-LTV customers and extract current traits
Track intent signals (content downloaded, webinar views, etc.) to refine your ICP
Leverage LinkedIn insights or tools like Clearbit to adjust based on real-time firmographic and technographic data
🛠️ Example: One B2B SaaS-focused Lead Generation Agency revised their ICP after noticing 70% of leads came from outdated industries. By narrowing their focus to fintech startups with Series A funding, they tripled conversion rates in 90 days.
2. The Cold Email Graveyard: Outdated Outbound Strategies That Kill Trust
If your outbound strategy still relies on spray-and-pray cold emails, you’re already behind. Email inboxes are smarter. Buyers are savvier. Algorithms punish irrelevant outreach.
Keyword used: Lead Generation Agency
📉 What's Going Wrong:
Using scraped lists with generic messages
Over-automated sequences that scream "bot"
Ignoring new data privacy regulations like GDPR/CPRA
✅ Fix It:
Switch to intent-based outbound: Use Bombora, ZoomInfo Intent, or LinkedIn to find prospects showing buying signals
Personalize 20% of each email with context that matters (recent funding, job change, etc.)
Use multichannel sequencing (email, LinkedIn, video DM)
Case Study Insight: A growth-stage Lead Generation Agency increased reply rates by 45% by integrating Loom video DMs into their outbound campaigns for high-ticket offers.
3. MQL Madness: When Marketing and Sales Speak Different Languages
A major issue we see in many Lead Generation Agencies is the disconnect between marketing-qualified leads (MQLs) and what sales actually needs. This misalignment causes finger-pointing, lead waste, and frustration across teams.
Keyword used: Lead Generation Agency
Red Flags:
Sales reps ignoring MQLs or complaining they’re unqualified
No feedback loop between sales and marketing
Leads passed to sales without proper nurturing
✅ Fix It:
Define lead scoring with the sales team, not in a silo
Introduce an SLA (Service Level Agreement) outlining lead handoff expectations
Build a pre-sales team to vet and warm up leads before they reach AE’s inbox
📈 Benefit: One healthcare-focused Lead Generation Agency saw their SQL-to-opportunity rate jump from 22% to 39% by implementing a pre-sales qualification layer.
4. Funnel Blind Spots: Failing to Optimize the Middle of the Funnel
Many agencies focus heavily on top-of-funnel (TOFU) acquisition, then wonder why leads fall off a cliff mid-way. The truth is, middle-of-funnel (MOFU) is where leads decide whether they trust you enough to continue the journey.
Keyword used: Lead Generation Agency
What’s Often Overlooked:
Educational content to build trust
Automated but personalized nurture sequences
Smart retargeting based on funnel behavior
✅ Fix It:
Create segmented email workflows for each persona and stage
Use retargeting ads (via Meta, Google, or LinkedIn) tied to mid-funnel content like case studies or comparison guides
Insert micro-conversions like quizzes, assessments, or tools (e.g., ROI calculator)
Example: One Lead Generation Agency that worked with legal tech clients built a “Legal Tech ROI Calculator” for MOFU leads—conversions increased by 60%.
5. The Attribution Black Hole: Not Knowing What’s Actually Working
If you can’t trace back which lead sources are driving revenue (not just leads), your decisions are just guesses. Many agencies still rely on basic UTM tracking or platform-native reporting.
Keyword used: Lead Generation Agency
🔍 The Real Problem:
Attribution is siloed across tools (CRM, ads, email, etc.)
Over-reliance on first-touch or last-touch models
No cohesive dashboard showing the full journey
✅ Fix It:
Implement a multi-touch attribution model with tools like HubSpot, Dreamdata, or Triple Whale
Use unique tracking links for every channel and asset
Align KPIs with client goals — not vanity metrics
Pro Insight: A D2C-focused Lead Generation Agency adopted multi-touch attribution and discovered 40% of their conversions came from podcasts they had never considered important.
Wrapping Up: Transforming Lead Volume into Revenue Growth
It’s not just about getting more leads. It’s about getting the right leads, nurturing them effectively, and aligning your strategy with how people actually buy today.
Let’s recap the key shifts:
Revisit and refine your ICP quarterly — not yearly
Make outbound smarter, more human, and more relevant
Align marketing and sales KPIs and lead definitions
Prioritize MOFU nurturing just as much as TOFU
Track revenue attribution, not just lead metrics
Next Step:
Try implementing one of these changes this week — maybe start with redefining your ICP or tweaking your outbound with personalized video.
And if you’re looking for help optimizing your own Lead Generation Agency, drop a comment or subscribe to our newsletter for expert tips every week.
0 notes
Text
Ravi Bommakanti, CTO of App Orchid – Interview Series
New Post has been published on https://thedigitalinsider.com/ravi-bommakanti-cto-of-app-orchid-interview-series/
Ravi Bommakanti, CTO of App Orchid – Interview Series

Ravi Bommakanti, Chief Technology Officer at App Orchid, leads the company’s mission to help enterprises operationalize AI across applications and decision-making processes. App Orchid’s flagship product, Easy Answers™, enables users to interact with data using natural language to generate AI-powered dashboards, insights, and recommended actions.
The platform integrates structured and unstructured data—including real-time inputs and employee knowledge—into a predictive data fabric that supports strategic and operational decisions. With in-memory Big Data technology and a user-friendly interface, App Orchid streamlines AI adoption through rapid deployment, low-cost implementation, and minimal disruption to existing systems.
Let’s start with the big picture—what does “agentic AI” mean to you, and how is it different from traditional AI systems?
Agentic AI represents a fundamental shift from the static execution typical of traditional AI systems to dynamic orchestration. To me, it’s about moving from rigid, pre-programmed systems to autonomous, adaptable problem-solvers that can reason, plan, and collaborate.
What truly sets agentic AI apart is its ability to leverage the distributed nature of knowledge and expertise. Traditional AI often operates within fixed boundaries, following predetermined paths. Agentic systems, however, can decompose complex tasks, identify the right specialized agents for sub-tasks—potentially discovering and leveraging them through agent registries—and orchestrate their interaction to synthesize a solution. This concept of agent registries allows organizations to effectively ‘rent’ specialized capabilities as needed, mirroring how human expert teams are assembled, rather than being forced to build or own every AI function internally.
So, instead of monolithic systems, the future lies in creating ecosystems where specialized agents can be dynamically composed and coordinated – much like a skilled project manager leading a team – to address complex and evolving business challenges effectively.
How is Google Agentspace accelerating the adoption of agentic AI across enterprises, and what’s App Orchid’s role in this ecosystem?
Google Agentspace is a significant accelerator for enterprise AI adoption. By providing a unified foundation to deploy and manage intelligent agents connected to various work applications, and leveraging Google’s powerful search and models like Gemini, Agentspace enables companies to transform siloed information into actionable intelligence through a common interface.
App Orchid acts as a vital semantic enablement layer within this ecosystem. While Agentspace provides the agent infrastructure and orchestration framework, our Easy Answers platform tackles the critical enterprise challenge of making complex data understandable and accessible to agents. We use an ontology-driven approach to build rich knowledge graphs from enterprise data, complete with business context and relationships – precisely the understanding agents need.
This creates a powerful synergy: Agentspace provides the robust agent infrastructure and orchestration capabilities, while App Orchid provides the deep semantic understanding of complex enterprise data that these agents require to operate effectively and deliver meaningful business insights. Our collaboration with the Google Cloud Cortex Framework is a prime example, helping customers drastically reduce data preparation time (up to 85%) while leveraging our platform’s industry-leading 99.8% text-to-SQL accuracy for natural language querying. Together, we empower organizations to deploy agentic AI solutions that truly grasp their business language and data intricacies, accelerating time-to-value.
What are real-world barriers companies face when adopting agentic AI, and how does App Orchid help them overcome these?
The primary barriers we see revolve around data quality, the challenge of evolving security standards – particularly ensuring agent-to-agent trust – and managing the distributed nature of enterprise knowledge and agent capabilities.
Data quality remains the bedrock issue. Agentic AI, like any AI, provides unreliable outputs if fed poor data. App Orchid tackles this foundationally by creating a semantic layer that contextualizes disparate data sources. Building on this, our unique crowdsourcing features within Easy Answers engage business users across the organization—those who understand the data’s meaning best—to collaboratively identify and address data gaps and inconsistencies, significantly improving reliability.
Security presents another critical hurdle, especially as agent-to-agent communication becomes common, potentially spanning internal and external systems. Establishing robust mechanisms for agent-to-agent trust and maintaining governance without stifling necessary interaction is key. Our platform focuses on implementing security frameworks designed for these dynamic interactions.
Finally, harnessing distributed knowledge and capabilities effectively requires advanced orchestration. App Orchid leverages concepts like the Model Context Protocol (MCP), which is increasingly pivotal. This enables the dynamic sourcing of specialized agents from repositories based on contextual needs, facilitating fluid, adaptable workflows rather than rigid, pre-defined processes. This approach aligns with emerging standards, such as Google’s Agent2Agent protocol, designed to standardize communication in multi-agent systems. We help organizations build trusted and effective agentic AI solutions by addressing these barriers.
Can you walk us through how Easy Answers™ works—from natural language query to insight generation?
Easy Answers transforms how users interact with enterprise data, making sophisticated analysis accessible through natural language. Here’s how it works:
Connectivity: We start by connecting to the enterprise’s data sources – we support over 200 common databases and systems. Crucially, this often happens without requiring data movement or replication, connecting securely to data where it resides.
Ontology Creation: Our platform automatically analyzes the connected data and builds a comprehensive knowledge graph. This structures the data into business-centric entities we call Managed Semantic Objects (MSOs), capturing the relationships between them.
Metadata Enrichment: This ontology is enriched with metadata. Users provide high-level descriptions, and our AI generates detailed descriptions for each MSO and its attributes (fields). This combined metadata provides deep context about the data’s meaning and structure.
Natural Language Query: A user asks a question in plain business language, like “Show me sales trends for product X in the western region compared to last quarter.”
Interpretation & SQL Generation: Our NLP engine uses the rich metadata in the knowledge graph to understand the user’s intent, identify the relevant MSOs and relationships, and translate the question into precise data queries (like SQL). We achieve an industry-leading 99.8% text-to-SQL accuracy here.
Insight Generation (Curations): The system retrieves the data and determines the most effective way to present the answer visually. In our platform, these interactive visualizations are called ‘curations’. Users can automatically generate or pre-configure them to align with specific needs or standards.
Deeper Analysis (Quick Insights): For more complex questions or proactive discovery, users can leverage Quick Insights. This feature allows them to easily apply ML algorithms shipped with the platform to specified data fields to automatically detect patterns, identify anomalies, or validate hypotheses without needing data science expertise.
This entire process, often completed in seconds, democratizes data access and analysis, turning complex data exploration into a simple conversation.
How does Easy Answers bridge siloed data in large enterprises and ensure insights are explainable and traceable?
Data silos are a major impediment in large enterprises. Easy Answers addresses this fundamental challenge through our unique semantic layer approach.
Instead of costly and complex physical data consolidation, we create a virtual semantic layer. Our platform builds a unified logical view by connecting to diverse data sources where they reside. This layer is powered by our knowledge graph technology, which maps data into Managed Semantic Objects (MSOs), defines their relationships, and enriches them with contextual metadata. This creates a common business language understandable by both humans and AI, effectively bridging technical data structures (tables, columns) with business meaning (customers, products, sales), regardless of where the data physically lives.
Ensuring insights are trustworthy requires both traceability and explainability:
Traceability: We provide comprehensive data lineage tracking. Users can drill down from any curations or insights back to the source data, viewing all applied transformations, filters, and calculations. This provides full transparency and auditability, crucial for validation and compliance.
Explainability: Insights are accompanied by natural language explanations. These summaries articulate what the data shows and why it’s significant in business terms, translating complex findings into actionable understanding for a broad audience.
This combination bridges silos by creating a unified semantic view and builds trust through clear traceability and explainability.
How does your system ensure transparency in insights, especially in regulated industries where data lineage is critical?
Transparency is absolutely non-negotiable for AI-driven insights, especially in regulated industries where auditability and defensibility are paramount. Our approach ensures transparency across three key dimensions:
Data Lineage: This is foundational. As mentioned, Easy Answers provides end-to-end data lineage tracking. Every insight, visualization, or number can be traced back meticulously through its entire lifecycle—from the original data sources, through any joins, transformations, aggregations, or filters applied—providing the verifiable data provenance required by regulators.
Methodology Visibility: We avoid the ‘black box’ problem. When analytical or ML models are used (e.g., via Quick Insights), the platform clearly documents the methodology employed, the parameters used, and relevant evaluation metrics. This ensures the ‘how’ behind the insight is as transparent as the ‘what’.
Natural Language Explanation: Translating technical outputs into understandable business context is crucial for transparency. Every insight is paired with plain-language explanations describing the findings, their significance, and potentially their limitations, ensuring clarity for all stakeholders, including compliance officers and auditors.
Furthermore, we incorporate additional governance features for industries with specific compliance needs like role-based access controls, approval workflows for certain actions or reports, and comprehensive audit logs tracking user activity and system operations. This multi-layered approach ensures insights are accurate, fully transparent, explainable, and defensible.
How is App Orchid turning AI-generated insights into action with features like Generative Actions?
Generating insights is valuable, but the real goal is driving business outcomes. With the correct data and context, an agentic ecosystem can drive actions to bridge the critical gap between insight discovery and tangible action, moving analytics from a passive reporting function to an active driver of improvement.
Here’s how it works: When the Easy Answers platform identifies a significant pattern, trend, anomaly, or opportunity through its analysis, it leverages AI to propose specific, contextually relevant actions that could be taken in response.
These aren’t vague suggestions; they are concrete recommendations. For instance, instead of just flagging customers at high risk of churn, it might recommend specific retention offers tailored to different segments, potentially calculating the expected impact or ROI, and even drafting communication templates. When generating these recommendations, the system considers business rules, constraints, historical data, and objectives.
Crucially, this maintains human oversight. Recommended actions are presented to the appropriate users for review, modification, approval, or rejection. This ensures business judgment remains central to the decision-making process while AI handles the heavy lifting of identifying opportunities and formulating potential responses.
Once an action is approved, we can trigger an agentic flow for seamless execution through integrations with operational systems. This could mean triggering a workflow in a CRM, updating a forecast in an ERP system, launching a targeted marketing task, or initiating another relevant business process – thus closing the loop from insight directly to outcome.
How are knowledge graphs and semantic data models central to your platform’s success?
Knowledge graphs and semantic data models are the absolute core of the Easy Answers platform; they elevate it beyond traditional BI tools that often treat data as disconnected tables and columns devoid of real-world business context. Our platform uses them to build an intelligent semantic layer over enterprise data.
This semantic foundation is central to our success for several key reasons:
Enables True Natural Language Interaction: The semantic model, structured as a knowledge graph with Managed Semantic Objects (MSOs), properties, and defined relationships, acts as a ‘Rosetta Stone’. It translates the nuances of human language and business terminology into the precise queries needed to retrieve data, allowing users to ask questions naturally without knowing underlying schemas. This is key to our high text-to-SQL accuracy.
Preserves Critical Business Context: Unlike simple relational joins, our knowledge graph explicitly captures the rich, complex web of relationships between business entities (e.g., how customers interact with products through support tickets and purchase orders). This allows for deeper, more contextual analysis reflecting how the business operates.
Provides Adaptability and Scalability: Semantic models are more flexible than rigid schemas. As business needs evolve or new data sources are added, the knowledge graph can be extended and modified incrementally without requiring a complete overhaul, maintaining consistency while adapting to change.
This deep understanding of data context provided by our semantic layer is fundamental to everything Easy Answers does, from basic Q&A to advanced pattern detection with Quick Insights, and it forms the essential foundation for our future agentic AI capabilities, ensuring agents can reason over data meaningfully.
What foundational models do you support, and how do you allow organizations to bring their own AI/ML models into the workflow?
We believe in an open and flexible approach, recognizing the rapid evolution of AI and respecting organizations’ existing investments.
For foundational models, we maintain integrations with leading options from multiple providers, including Google’s Gemini family, OpenAI’s GPT models, and prominent open-source alternatives like Llama. This allows organizations to choose models that best fit their performance, cost, governance, or specific capability needs. These models power various platform features, including natural language understanding for queries, SQL generation, insight summarization, and metadata generation.
Beyond these, we provide robust pathways for organizations to bring their own custom AI/ML models into the Easy Answers workflow:
Models developed in Python can often be integrated directly via our AI Engine.
We offer seamless integration capabilities with major cloud ML platforms such as Google Vertex AI and Amazon SageMaker, allowing models trained and hosted there to be invoked.
Critically, our semantic layer plays a key role in making these potentially complex custom models accessible. By linking model inputs and outputs to the business concepts defined in our knowledge graph (MSOs and properties), we allow non-technical business users to leverage advanced predictive, classification or causal models (e.g., through Quick Insights) without needing to understand the underlying data science – they interact with familiar business terms, and the platform handles the technical translation. This truly democratizes access to sophisticated AI/ML capabilities.
Looking ahead, what trends do you see shaping the next wave of enterprise AI—particularly in agent marketplaces and no-code agent design?
The next wave of enterprise AI is moving towards highly dynamic, composable, and collaborative ecosystems. Several converging trends are driving this:
Agent Marketplaces and Registries: We’ll see a significant rise in agent marketplaces functioning alongside internal agent registries. This facilitates a shift from monolithic builds to a ‘rent and compose’ model, where organizations can dynamically discover and integrate specialized agents—internal or external—with specific capabilities as needed, dramatically accelerating solution deployment.
Standardized Agent Communication: For these ecosystems to function, agents need common languages. Standardized agent-to-agent communication protocols, such as MCP (Model Context Protocol), which we leverage, and initiatives like Google’s Agent2Agent protocol, are becoming essential for enabling seamless collaboration, context sharing, and task delegation between agents, regardless of who built them or where they run.
Dynamic Orchestration: Static, pre-defined workflows will give way to dynamic orchestration. Intelligent orchestration layers will select, configure, and coordinate agents at runtime based on the specific problem context, leading to far more adaptable and resilient systems.
No-Code/Low-Code Agent Design: Democratization will extend to agent creation. No-code and low-code platforms will empower business experts, not just AI specialists, to design and build agents that encapsulate specific domain knowledge and business logic, further enriching the pool of available specialized capabilities.
App Orchid’s role is providing the critical semantic foundation for this future. For agents in these dynamic ecosystems to collaborate effectively and perform meaningful tasks, they need to understand the enterprise data. Our knowledge graph and semantic layer provide exactly that contextual understanding, enabling agents to reason and act upon data in relevant business terms.
How do you envision the role of the CTO evolving in a future where decision intelligence is democratized through agentic AI?
The democratization of decision intelligence via agentic AI fundamentally elevates the role of the CTO. It shifts from being primarily a steward of technology infrastructure to becoming a strategic orchestrator of organizational intelligence.
Key evolutions include:
From Systems Manager to Ecosystem Architect: The focus moves beyond managing siloed applications to designing, curating, and governing dynamic ecosystems of interacting agents, data sources, and analytical capabilities. This involves leveraging agent marketplaces and registries effectively.
Data Strategy as Core Business Strategy: Ensuring data is not just available but semantically rich, reliable, and accessible becomes paramount. The CTO will be central in building the knowledge graph foundation that powers intelligent systems across the enterprise.
Evolving Governance Paradigms: New governance models will be needed for agentic AI – addressing agent trust, security, ethical AI use, auditability of automated decisions, and managing emergent behaviors within agent collaborations.
Championing Adaptability: The CTO will be crucial in embedding adaptability into the organization’s technical and operational fabric, creating environments where AI-driven insights lead to rapid responses and continuous learning.
Fostering Human-AI Collaboration: A key aspect will be cultivating a culture and designing systems where humans and AI agents work synergistically, augmenting each other’s strengths.
Ultimately, the CTO becomes less about managing IT costs and more about maximizing the organization’s ‘intelligence potential’. It’s a shift towards being a true strategic partner, enabling the entire business to operate more intelligently and adaptively in an increasingly complex world.
Thank you for the great interview, readers who wish to learn more should visit App Orchid.
#adoption#agent#Agentic AI#agents#ai#AI adoption#AI AGENTS#AI systems#AI-powered#AI/ML#Algorithms#Amazon#amp#Analysis#Analytics#anomalies#anomaly#app#App Orchid#applications#approach#attributes#audit#autonomous#bedrock#bi#bi tools#Big Data#black box#box
0 notes
Text
How do analysts find data trends?
Data analysts use a structured approach to discover trends within data, which involves collecting, processing, analyzing, and interpreting data to extract meaningful insights. The process begins with data collection from various sources such as databases, surveys, sensors, or business systems. This data can be structured (like SQL databases) or unstructured (such as logs or social media content).
Once the data is gathered, cleaning and preprocessing is essential to remove errors, duplicates, or irrelevant values. Tools like Excel, Python (with libraries such as Pandas and NumPy), or R are widely used for this step. Clean data ensures more accurate trend analysis.
The next step is exploratory data analysis (EDA), where analysts use statistical techniques to understand patterns. Visualizations play a key role in EDA — charts, histograms, scatter plots, and line graphs help identify relationships and anomalies. Software like Tableau, Power BI, or Matplotlib in Python assist in building these visuals.
Analysts then apply trend analysis methods, such as moving averages, regression analysis, and time series analysis, to detect patterns over time. They may segment data by categories (e.g., region, product, customer type) to spot trends that may not be visible in aggregate data.
To confirm these trends, analysts often run hypothesis tests or apply predictive models to forecast future behavior. Contextual knowledge about the domain (e.g., finance, marketing, healthcare) helps interpret the trends accurately and make informed business decisions.
Finally, findings are compiled into dashboards or reports for stakeholders, enabling strategic planning and action.
To build these skills and learn practical techniques, enrolling in an offline data analytics course can provide hands-on experience with real-world datasets and expert guidance.
0 notes
Text
ARMxy SBC Embedded Industrial Computer with TimescaleDB Database for traffic flow monitoring

Case Details
TimescaleDB is an open-source time-series database built on PostgreSQL, designed for efficiently handling large-scale time-series data. It combines the flexibility of relational databases with optimized performance for time-series data, making it an ideal choice for traffic flow monitoring when paired with the ARMxy SBC Embedded Industrial Computer. It can process real-time data such as vehicle speed, traffic flow, and congestion, supporting traffic management and optimization.
Core Features of TimescaleDB
High-Performance Writes and Queries: Supports millions of data points per second for writing and fast querying, suitable for high-frequency traffic data collection and analysis.
Data Compression: Compresses data to 5-10% of its original size, reducing storage costs and ideal for long-term storage of traffic data.
Data Retention Policies: Automatically deletes outdated data to optimize storage, such as retaining only the past year's data.
SQL Compatibility: Uses standard SQL queries and is compatible with PostgreSQL's ecosystem, supporting extensions for geospatial analysis and machine learning.
Continuous Aggregates and Real-Time Views: Provides pre-computed aggregates (e.g., hourly traffic statistics) and real-time views for dynamic monitoring.
Scalability: Supports distributed deployments for multi-regional traffic data management and can run on cloud or local servers.
Open-Source and Community Support: Free open-source version with an active community and extensive documentation; commercial versions offer advanced features.
Advantages of TimescaleDB in Traffic Flow Monitoring
When integrated with the ARMxy SBC, TimescaleDB offers the following benefits for traffic flow monitoring:
Real-Time Data Processing: Efficiently stores high-frequency data collected by ARMxy SBC from sensors (e.g., speed radars, cameras) and supports real-time queries to monitor current road conditions.
Historical Data Analysis: Analyzes historical traffic data to identify patterns such as peak hours or congestion points, optimizing traffic management and road planning.
Congestion Prediction: Supports integration with machine learning tools to predict future congestion based on historical data, enabling proactive warnings.
Geospatial Analysis: With PostgreSQL’s PostGIS extension, it can analyze traffic conditions in specific areas, generating regional traffic heatmaps.
Dashboard Integration: Seamlessly integrates with Grafana or ARMxy SBC Qt interface to display real-time and historical traffic data.
Efficient Storage: Compression reduces storage needs, accommodating large datasets from multiple sensors.
Implementation of TimescaleDB in the ARMxy SBC Solution
System Architecture
Data Collection:
ARMxy SBC connects to sensors like speed radars, traffic counters, and cameras via X/Y-series I/O boards.
Uses its built-in NPU for edge AI processing, such as vehicle detection or license plate recognition.
Data Transmission:
ARMxy SBC transmits data to TimescaleDB via 4G/5G modules or Ethernet using the MQTT protocol.
BLIoTLink software ensures protocol compatibility.
Data Storage:
TimescaleDB, deployed on the cloud or locally, stores data including timestamps, road IDs, speeds, flow, and congestion indices.
Configures compression and retention policies to optimize storage.
Data Analysis:
Generates real-time statistics, such as hourly or daily traffic flow.
Analyzes historical data to identify traffic patterns.
Visualization and Prediction:
Displays real-time dashboards using Grafana or Qt interfaces.
Predicts congestion trends based on historical data.
Deployment Process
Install TimescaleDB on ARMxy SBC supported Ubuntu environment or a cloud/local server.
Configure ARMxy SBC Node-RED or Python scripts to collect and transmit sensor data.
Set up data tables in TimescaleDB with compression and retention policies.
Integrate visualization tools to display real-time and historical data.
Regularly maintain ARMxy SBC and TimescaleDB to optimize performance.
Considerations
Data Volume Management: Traffic data can be voluminous, so allocate sufficient storage for TimescaleDB, preferably using SSDs.
Network Reliability: Outdoor environments may have unstable 4G/5G signals; configure local caching on ARMxy SBC to sync data when the network is restored.
Security: Enable MQTT encryption and TimescaleDB access controls to protect data.
Performance Optimization: Adjust TimescaleDB’s partitioning strategy to minimize query latency.
Expected Outcomes
Real-Time Monitoring: Updates road traffic, speed, and congestion status in seconds.
Data Insights: Analyzes traffic patterns to optimize signal timing and road planning.
Congestion Prediction: Predicts peak-hour congestion for proactive warnings.
Efficient Storage: Compression reduces costs for long-term operation.
Expansion Possibilities
Multi-Road Monitoring: ARMxy SBC supports multiple roads by expanding I/O boards.
Geospatial Analysis: Integrates with PostGIS for city-wide traffic network analysis.
Cloud Platform Integration: Connects to AWS, Alibaba Cloud, etc., via BLIoTLink for cross-regional management.
Intelligent Transportation: Extends to vehicle-to-everything (V2X) or cooperative vehicle-infrastructure systems.
0 notes
Text
Data Science Project Support: Expert Help from Gritty Tech
In today’s digital era, data science project support is more essential than ever. Students and professionals across the globe are diving deep into complex datasets, algorithms, and analytics—but often need the right guidance to complete their projects successfully. That’s where Gritty Tech steps in, offering top-notch data science project support for learners at all levels For More…
Whether you’re stuck on machine learning models, struggling to clean large datasets, or preparing for a big project submission, Gritty Tech’s data science project support can help you every step of the way.
Why Choose Gritty Tech for Data Science Project Support?
Gritty Tech isn’t just another tutoring service—it’s a global network of highly skilled professionals offering premium-level data science project support at affordable prices.
1. High-Quality, Personalized Assistance
Every student or professional project has unique challenges. That’s why our data science project support is customized to your goals, whether you’re focused on predictive modeling, NLP, or deep learning.
2. Professional Tutors from 110+ Countries
With a worldwide network of tutors, Gritty Tech ensures your data science project support comes from experts with real-world industry experience, academic backgrounds, and proven success.
3. Easy Refund Policy and Tutor Replacement
We understand trust is crucial. If you’re not satisfied with our data science project support, you can request a refund or a tutor replacement—no questions asked.
4. Flexible Payment Plans
We offer various payment options to make your data science project support journey smooth. Choose from monthly billing, session-wise payments, or custom plans that fit your budget.
What Areas Does Gritty Tech Cover in Data Science Project Support?
Our data science project support covers a wide range of topics, such as:
Python and R Programming for Data Science
Machine Learning Algorithms (Supervised and Unsupervised)
Data Cleaning and Preprocessing
Data Visualization with Matplotlib, Seaborn, or Power BI
Statistical Analysis and Inference
Deep Learning with TensorFlow and PyTorch
Time Series Forecasting
Big Data Tools (Spark, Hadoop)
Database Management and SQL
Capstone Project Guidance and Report Writing
Each of these areas is handled with precise attention to detail, ensuring our data science project support is thorough and effective.
Who Can Benefit from Data Science Project Support?
Undergraduate and Postgraduate Students working on final-year or capstone projects.
Working Professionals trying to automate processes or prepare presentations for stakeholders.
Researchers and Ph.D. Candidates needing help with modeling or analysis.
Self-Learners who have taken online courses and want hands-on project mentorship.
Wherever you are on your data journey, our data science project support is tailored to fit.
Why Trust Gritty Tech?
At Gritty Tech, trust is everything. Here's what makes our data science project support trustworthy and effective:
Over 98% client satisfaction rate.
More than 20,000 successful projects delivered.
Real-time collaboration tools and feedback.
Tutors who are patient, responsive, and clear.
Confidential handling of all project data.
When you choose Gritty Tech’s data science project support, you're not just hiring a tutor—you’re gaining a partner in success.
10 FAQs about Data Science Project Support
What is data science project support and how does it help me?
Data science project support refers to expert guidance and mentorship on your data science tasks, ensuring you meet academic or professional goals efficiently.
Who provides the data science project support at Gritty Tech?
Our data science project support is offered by qualified professionals with advanced degrees and real-world experience in data analytics, AI, and programming.
Can I get one-on-one data science project support?
Absolutely! Gritty Tech specializes in personalized data science project support, offering one-on-one mentorship tailored to your unique requirements.
What platforms and tools do you use in your data science project support?
We use Jupyter Notebook, Python, R, SQL, Power BI, Tableau, and machine learning libraries like scikit-learn and TensorFlow during data science project support sessions.
Do you help with academic submissions in your data science project support?
Yes, our data science project support includes report creation, code documentation, and presentation slide preparation to align with university requirements.
Is your data science project support suitable for beginners?
Definitely! Our tutors adjust the complexity of data science project support based on your current knowledge level.
Can I change my tutor if I’m not satisfied with my data science project support?
Yes, our flexible policy allows tutor replacements to guarantee your satisfaction with our data science project support.
How do I schedule sessions for data science project support?
Once registered, you can easily schedule or reschedule your data science project support sessions via our portal or WhatsApp.
Do you offer emergency or fast-track data science project support?
Yes, we provide expedited data science project support for urgent deadlines, with express delivery options available.
How do I start with Gritty Tech’s data science project support?
Just contact our team, explain your requirements, and we’ll match you with a qualified tutor for the best data science project support experience.
Final Thoughts: Let Gritty Tech Handle Your Data Science Project Challenges
Completing a data science project can be overwhelming, but you don’t have to do it alone. With data science project support from Gritty Tech, you gain access to expert mentorship, affordable plans, and full project guidance—backed by a no-risk satisfaction policy.
If you’re looking for reliable, flexible, and effective data science project support, trust Gritty Tech to elevate your project and learning experience.
Contact us today and let our data science project support take your success to the next level.
0 notes
Text
Top Data Analysis Methods in 2025: A Complete Guide for Beginners and Professionals

🚀 Introduction: Why Data Analysis Methods Matter Today
We live in a world overflowing with data—from social media stats and website clicks to sales transactions and customer feedback. But raw data alone is meaningless. It’s only through the use of data analysis methods that we can extract actionable insights and make informed decisions.
Whether you’re a business owner, student, analyst, or entrepreneur, understanding data analysis methods is no longer optional—it’s essential.
In this article, we’ll explore the most widely used data analysis methods, their benefits, tools, use cases, expert opinions, and FAQs—all written in a human-friendly, easy-to-understand tone.
🔍 What Are Data Analysis Methods?
Data analysis methods are systematic approaches used to examine, transform, and interpret data to discover patterns, trends, and insights. These methods range from simple descriptive statistics to complex predictive algorithms.
By using the right method, businesses and analysts can:
📈 Identify trends
💡 Solve business problems
🔮 Forecast future outcomes
🎯 Improve performance
📘 Types of Data Analysis Methods
Here’s a detailed breakdown of the major types of data analysis methods you should know in 2025:
1. Descriptive Analysis
Goal: Summarize historical data to understand what has happened. Example: Monthly revenue report, user growth trends.
Techniques Used:
Mean, median, mode
Frequency distribution
Data visualization (charts, graphs)
Best Tools: Excel, Tableau, Google Data Studio
2. Exploratory Data Analysis (EDA)
Goal: Explore the dataset to uncover initial patterns, detect outliers, and identify relationships. Example: Discovering patterns in customer purchase history.
Techniques Used:
Box plots, scatter plots, heat maps
Correlation matrix
Data cleaning
Best Tools: Python (Pandas, Matplotlib), R, Power BI
3. Inferential Analysis
Goal: Make predictions or generalizations about a larger population based on sample data. Example: Predicting election results based on sample polling.
Techniques Used:
Hypothesis testing
Confidence intervals
T-tests, chi-square tests
Best Tools: SPSS, R, Python (SciPy)
4. Diagnostic Analysis
Goal: Determine the causes of a past event or outcome. Example: Why did the bounce rate increase last month?
Techniques Used:
Root cause analysis
Regression analysis
Data mining
Best Tools: SQL, Power BI, SAS
5. Predictive Analysis
Goal: Forecast future outcomes based on historical data. Example: Predicting next month’s sales based on seasonal trends.
Techniques Used:
Machine learning (decision trees, random forest)
Time series analysis
Neural networks
Best Tools: Python (Scikit-learn, TensorFlow), IBM Watson
6. Prescriptive Analysis
Goal: Recommend actions based on predicted outcomes. Example: Suggesting product pricing for maximum profitability.
Techniques Used:
Optimization
Simulation modeling
Decision trees
Best Tools: MATLAB, Excel Solver, Gurobi
7. Quantitative Analysis
Goal: Focus on numerical data to understand trends and measure outcomes. Example: Measuring website conversion rates.
Techniques Used:
Statistical modeling
Data aggregation
Regression
8. Qualitative Analysis
Goal: Analyze non-numerical data like text, images, or videos. Example: Analyzing customer reviews or survey responses.
Techniques Used:
Sentiment analysis
Thematic coding
Content analysis
Best Tools: NVivo, Lexalytics, Google NLP API
💼 Use Cases of Data Analysis Methods in the Real World
Here’s how businesses use these methods across industries:
🛍 Retail
Method Used: Predictive & diagnostic
Purpose: Forecast demand, understand sales dips
💳 Banking
Method Used: Inferential & prescriptive
Purpose: Detect fraud, assess risk
🏥 Healthcare
Method Used: Diagnostic & descriptive
Purpose: Patient outcome analysis, treatment optimization
📱 Tech Companies
Method Used: Exploratory & predictive
Purpose: App usage patterns, churn prediction
🛠 Best Tools for Applying Data Analysis Methods
Tool NameKey FeaturesSuitable ForExcelCharts, pivot tables, formulasBeginnersPythonML, EDA, statistical analysisIntermediate to ExpertR LanguageStatistical modeling, data visualizationIntermediateTableauVisual dashboardsBusiness analystsPower BIIntegration with Microsoft appsEnterprisesSQLQuerying large datasetsData engineers
🌟 Real Reviews From Experts
“I started with Excel for simple descriptive analysis and gradually moved to Python for predictive modeling. The transition was smoother than I expected.” – Neha D., Data Analyst at a Startup
“We used prescriptive methods in Power BI to optimize our logistics routes. Saved us 20% in transport costs within three months.” – Arjun K., Supply Chain Manager
“Using EDA methods helped us detect user drop-off points in our app, which we quickly fixed.” – Priya S., UX Designer
📌 Step-by-Step Guide to Choosing the Right Data Analysis Method
Define Your Objective: What do you want to find out?
Identify Data Type: Is it qualitative or quantitative?
Choose Your Tool: Based on your team’s skill level.
Clean the Data: Remove duplicates, null values, outliers.
Apply the Method: Use the appropriate model/technique.
Visualize & Interpret: Create charts to simplify interpretation.
Take Action: Use insights to make data-driven decisions.
❓ Frequently Asked Questions (FAQs)
🔹 Q1. What is the difference between data analysis methods and data analysis techniques?
A: Methods refer to the broad approach (e.g., descriptive, predictive), while techniques are specific tools or processes (e.g., regression, clustering).
🔹 Q2. Which data analysis method should I use as a beginner?
A: Start with descriptive and exploratory analysis. These are easy to learn and highly insightful.
🔹 Q3. Do I need coding skills to use these methods?
A: Not always. Tools like Excel, Tableau, and Power BI require minimal to no coding. For advanced analysis (e.g., machine learning), coding helps.
🔹 Q4. Can I use multiple methods in one project?
A: Absolutely! Many real-world projects use a combination of methods for deeper insights.
🔹 Q5. Which is the most powerful data analysis method?
A: That depends on your goal. For forecasting, predictive analysis is powerful. For decision-making, prescriptive analysis works best.
🧠 Tips to Master Data Analysis Methods in 2025
📝 Take online courses (Coursera, Udemy, DataCamp)
💻 Practice with real datasets (Kaggle, Google Dataset Search)
🧮 Understand the math behind techniques
📊 Visualize findings to communicate better
👥 Collaborate with other analysts and teams
✅ Conclusion: Your Data, Your Power
Data is no longer just for analysts or IT professionals. In 2025, knowing how to use data analysis methods can set you apart in virtually any profession. From optimizing marketing campaigns to launching new products, these methods empower you to make data-driven decisions with confidence.
So whether you’re just starting out or looking to level up, keep experimenting, keep analyzing, and let your data tell the story.
🌐 Read more expert data analysis content at diglip7.com 📩 Have questions? Drop a comment or connect with us for consultation.
0 notes
Text
Data Lake Integration with Azure Data Factory: Best Practices and Patterns

As businesses scale their data needs, Azure Data Lake becomes a go-to storage solution — offering massive scalability, low-cost storage, and high performance. When paired with Azure Data Factory (ADF), you get a powerful combo for ingesting, transforming, and orchestrating data pipelines across hybrid environments.
In this blog, we’ll explore best practices and design patterns for integrating Azure Data Lake with ADF, so you can build efficient, secure, and scalable data pipelines.
🔗 Why Use Azure Data Lake with Azure Data Factory?
Cost-effective storage for raw and processed data
Flexible schema support for semi-structured/unstructured data
Seamless integration with Azure Synapse, Databricks, and Power BI
Built-in support in ADF via Copy Activity, Mapping Data Flows, and linked services
🧱 Architecture Overview
A common architecture pattern:pgsqlSource Systems → ADF (Copy/Ingest) → Azure Data Lake (Raw/Curated Zones) ↓ ADF Mapping Data Flows / Databricks ↓ Azure SQL / Synapse Analytics / Reporting Layer
This flow separates ingestion, transformation, and consumption layers for maintainability and performance.
✅ Best Practices for Azure Data Lake Integration
1. Organize Your Data Lake into Zones
Raw Zone: Original source data, untouched
Curated Zone: Cleaned and transformed data
Business/Gold Zone: Finalized datasets for analytics/reporting
Use folder structures like:swift/raw/sales/2025/04/10/ /curated/sales/monthly/ /gold/sales_summary/
💡 Tip: Include metadata such as ingestion date and source system in folder naming.
2. Parameterize Your Pipelines
Make your ADF pipelines reusable by using:
Dataset parameters
Dynamic content for file paths
Pipeline parameters for table/source names
This allows one pipeline to support multiple tables/files with minimal maintenance.
3. Use Incremental Loads Instead of Full Loads
Avoid loading entire datasets repeatedly. Instead:
Use Watermark Columns (e.g., ModifiedDate)
Leverage Last Modified Date or Delta files
Track changes using control tables
4. Secure Your Data Lake Access
Use Managed Identities with RBAC to avoid hardcoded keys
Enable Access Logging and Firewall Rules
Implement Private Endpoints for data lake access inside virtual networks
5. Monitor and Handle Failures Gracefully
Enable Activity-level retries in ADF
Use custom error handling with Web Activities or Logic Apps
Integrate Azure Monitor for alerts on pipeline failures
📐 Common Patterns for Data Lake + ADF
Pattern 1: Landing Zone Ingestion
ADF pulls data from external sources (SQL, API, SFTP) → saves to /raw/ zone. Best for: Initial ingestion, batch processing
Pattern 2: Delta Lake via Data Flows
Use ADF Mapping Data Flows to apply slowly changing dimensions or upserts to data in the curated zone.
Pattern 3: Metadata-Driven Framework
Maintain metadata tables (in SQL or JSON) defining:
Source system
File location
Transformations
Schedul
ADF reads these to dynamically build pipelines — enabling automation and scalability.
Pattern 4: Hierarchical Folder Loading
Design pipelines that traverse folder hierarchies (e.g., /year/month/day) and load data in parallel. Great for partitioned and time-series data.
🚀 Performance Tips
Enable Data Partitioning in Data Flows
Use Staging in Blob if needed for large file ingestion
Tune Data Integration Units (DIUs) for large copy activities
Compress large files (Parquet/Avro) instead of CSVs when possible
🧠 Wrapping Up
When used effectively, Azure Data Factory + Azure Data Lake can become the backbone of your cloud data platform. By following the right patterns and best practices, you’ll ensure your pipelines are not only scalable but also secure, maintainable, and future-ready.
WEBSITE: https://www.ficusoft.in/azure-data-factory-training-in-chennai/
0 notes
Text
Bigtable SQL Introduces Native Support for Real-Time Queries

Upgrades to Bigtable SQL offer scalable, fast data processing for contemporary analytics. Simplify procedures and accelerate business decision-making.
Businesses have battled for decades to use data for real-time operations. Bigtable, Google Cloud's revolutionary NoSQL database, powers global, low-latency apps. It was built to solve real-time application issues and is now a crucial part of Google's infrastructure, along with YouTube and Ads.
Continuous materialised views, an enhancement of Bigtable's SQL capabilities, were announced at Google Cloud Next this week. Maintaining Bigtable's flexible schema in real-time applications requires well-known SQL syntax and specialised skills. Fully managed, real-time application backends are possible with Bigtable SQL and continuous materialised views.
Bigtable has gotten simpler and more powerful, whether you're creating streaming apps, real-time aggregations, or global AI research on a data stream.
The Bigtable SQL interface is now generally available.
SQL capabilities, now generally available in Bigtable, has transformed the developer experience. With SQL support, Bigtable helps development teams work faster.
Bigtable SQL enhances accessibility and application development by speeding data analysis and debugging. This allows KNN similarity search for improved product search and distributed counting for real-time dashboards and metric retrieval. Bigtable SQL's promise to expand developers' access to Bigtable's capabilities excites many clients, from AI startups to financial institutions.
Imagine AI developing and understanding your whole codebase. AI development platform Augment Code gives context for each feature. Scalability and robustness allow Bigtable to handle large code repositories. This user-friendliness allowed it to design security mechanisms that protect clients' valuable intellectual property. Bigtable SQL will help onboard new developers as the company grows. These engineers can immediately use Bigtable's SQL interface to access structured, semi-structured, and unstructured data.
Equifax uses Bigtable to store financial journals efficiently in its data fabric. The data pipeline team found Bigtable's SQL interface handy for direct access to corporate data assets and easier for SQL-savvy teams to use. Since more team members can use Bigtable, it expects higher productivity and integration.
Bigtable SQL also facilitates the transition between distributed key-value systems and SQL-based query languages like HBase with Apache Phoenix and Cassandra.
Pega develops real-time decisioning apps with minimal query latency to provide clients with real-time data to help their business. As it seeks database alternatives, Bigtable's new SQL interface seems promising.
Bigtable is also previewing structured row keys, GROUP BYs, aggregations, and a UNPACK transform for timestamped data in its SQL language this week.
Continuously materialising views in preview
Bigtable SQL works with Bigtable's new continuous materialised views (preview) to eliminate data staleness and maintenance complexity. This allows real-time data aggregation and analysis in social networking, advertising, e-commerce, video streaming, and industrial monitoring.
Bigtable views update gradually without impacting user queries and are fully controllable. Bigtable materialised views accept a full SQL language with functions and aggregations.
Bigtable's Materialised Views have enabled low-latency use cases for Google Cloud's Customer Data Platform customers. It eliminates ETL complexity and delay in time series use cases by setting SQL-based aggregations/transformations upon intake. Google Cloud uses data transformations during import to give AI applications well prepared data with reduced latency.
Ecosystem integration
Real-time analytics often require low-latency data from several sources. Bigtable's SQL interface and ecosystem compatibility are expanding, making end-to-end solutions using SQL and basic connections easier.
Open-source Apache Large Table Washbasin Kafka
Companies utilise Google Cloud Managed Service for Apache Kafka to build pipelines for Bigtable and other analytics platforms. The Bigtable team released a new Apache Kafka Bigtable Sink to help clients build high-performance data pipelines. This sends Kafka data to Bigtable in milliseconds.
Open-source Apache Flink Connector for Bigtable
Apache Flink allows real-time data modification via stream processing. The new Apache Flink to Bigtable Connector lets you design a pipeline that modifies streaming data and publishes it to Bigtable using the more granular Datastream APIs and the high-level Apache Flink Table API.
BigQuery Continuous Queries are commonly available
BigQuery continuous queries run SQL statements continuously and export output data to Bigtable. This widely available capability can let you create a real-time analytics database using Bigtable and BigQuery.
Python developers may create fully-managed jobs that synchronise offline BigQuery datasets with online Bigtable datasets using BigQuery's Python frameworks' bigrames streaming API.
Cassandra-compatible Bigtable CQL Client Bigtable is previewed.
Apache Cassandra uses CQL. Bigtable CQL Client enables developers utilise CQL on enterprise-grade, high-performance Bigtable without code modifications as they migrate programs. Bigtable supports Cassandra's data migration tools, which reduce downtime and operational costs, and ecosystem utilities like the CQL shell.
Use migrating tools and Bigtable CQL Client here.
Using SQL power via NoSQL. This blog addressed a key feature that lets developers use SQL with Bigtable. Bigtable Studio lets you use SQL from any Bigtable cluster and create materialised views on Flink and Kafka data streams.
#technology#technews#govindhtech#news#technologynews#cloud computing#Bigtable SQL#Continuous Queries#Apache Flink#BigQuery Continuous Queries#Bigtable#Bigtable CQL Client#Open-source Kafka#Apache Kafka
0 notes
Text
Data Analysis and Visualization Using Programming Techniques

Data analysis and visualization are crucial skills in today’s data-driven world. With programming, we can extract insights, uncover patterns, and present data in a meaningful way. This post explores how developers and analysts can use programming techniques to analyze and visualize data efficiently.
Why Data Analysis and Visualization Matter
Better Decisions: Informed decisions are backed by data and its interpretation.
Communication: Visualizations make complex data more accessible and engaging.
Pattern Recognition: Analysis helps discover trends, anomalies, and correlations.
Performance Tracking: Measure progress and identify areas for improvement.
Popular Programming Languages for Data Analysis
Python: Rich in libraries like Pandas, NumPy, Matplotlib, Seaborn, and Plotly.
R: Designed specifically for statistics and visualization.
JavaScript: Great for interactive, web-based data visualizations using D3.js and Chart.js.
SQL: Essential for querying and manipulating data from databases.
Basic Workflow for Data Analysis
Collect Data: From CSV files, APIs, databases, or web scraping.
Clean Data: Handle missing values, duplicates, and inconsistent formatting.
Explore Data: Use descriptive statistics and visual tools to understand the dataset.
Analyze Data: Apply transformations, groupings, and statistical techniques.
Visualize Results: Create charts, graphs, and dashboards.
Interpret & Share: Draw conclusions and present findings to stakeholders.
Python Example: Data Analysis and Visualization
import pandas as pd import seaborn as sns import matplotlib.pyplot as plt # Load data data = pd.read_csv('data.csv') # Analyze print(data.describe()) # Visualize sns.histplot(data['sales'], bins=10) plt.title('Sales Distribution') plt.xlabel('Sales') plt.ylabel('Frequency') plt.show()
Common Visualization Types
Bar Chart: Comparing categories
Line Chart: Time series analysis
Pie Chart: Proportional distribution
Scatter Plot: Correlation and clustering
Heatmap: Matrix-like data comparisons
Best Practices for Data Visualization
Keep it simple and avoid clutter.
Use colors to enhance, not distract.
Label axes, legends, and titles clearly.
Choose the right chart type for your data.
Ensure your visualizations are responsive and interactive if web-based.
Useful Libraries and Tools
Pandas & NumPy: Data manipulation
Matplotlib & Seaborn: Static visualizations
Plotly & Dash: Interactive dashboards
D3.js: Custom web-based visualizations
Power BI & Tableau: Business-level dashboarding (non-programming)
Real-World Use Cases
Sales Analysis: Visualize revenue trends and top-selling products.
Marketing Campaigns: Analyze click-through rates and conversions.
Healthcare: Monitor patient data, diagnostics, and treatment outcomes.
Finance: Analyze stock performance and predict market trends.
Conclusion
Combining data analysis with programming unlocks powerful insights and allows you to communicate results effectively. Whether you’re a beginner or an experienced developer, mastering data visualization techniques will significantly enhance your ability to solve problems and tell compelling data stories.
0 notes
Text
Key Skills You Need to Move from Data Analyst to Data Scientist
Transitioning from a data analyst to a data scientist requires expanding your skill set beyond basic data manipulation and visualization. While both roles revolve around extracting insights from data, data scientists rely heavily on machine learning, programming, and advanced statistical techniques to build predictive models. If you are a data analyst looking to move into data science, developing key technical and analytical skills is crucial. This blog outlines the essential skills you need to successfully transition into a data science role from the best Data Analytics Online Training.

Programming Proficiency: Python and R
A fundamental requirement for data science is strong programming skills. While data analysts often use SQL and Excel, data scientists must be proficient in Python or R. These languages are widely used in machine learning and statistical analysis. Python, in particular, is a preferred choice due to its vast ecosystem of libraries like Pandas, NumPy, Matplotlib, and Seaborn for data manipulation and visualization. Additionally, frameworks such as Scikit-learn, TensorFlow, and PyTorch enable machine learning model development. Mastering these tools is essential for handling large datasets and building predictive models.
Advanced Statistics and Probability
While data analysts use basic statistical techniques to summarize data and find patterns, data scientists require a deeper understanding of statistics and probability. Concepts such as hypothesis testing, Bayesian inference, A/B testing, regression analysis, and time series forecasting play a significant role in making data-driven decisions. Strong statistical knowledge helps in feature selection, model evaluation, and performance optimization. If you want to learn more about Data Analytics, consider enrolling in an Best Online Training & Placement programs . They often offer certifications, mentorship, and job placement opportunities to support your learning journey.
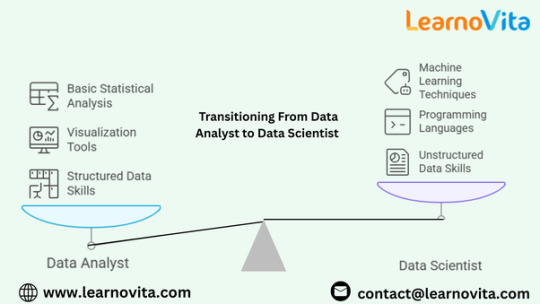
Machine Learning and Deep Learning
One of the biggest differences between data analysts and data scientists is the ability to build machine learning models. Data scientists use supervised learning techniques like classification and regression, as well as unsupervised methods like clustering and dimensionality reduction. Understanding model training, evaluation metrics, and hyperparameter tuning is crucial. Additionally, learning deep learning concepts such as neural networks, natural language processing (NLP), and computer vision can further expand career opportunities.
Data Wrangling and Preprocessing
Real-world data is often messy and unstructured, making data preprocessing a critical step in data science. Data scientists must be skilled in handling missing values, dealing with outliers, normalizing and transforming data, and feature engineering. Tools like Pandas, SQL, and OpenCV help in cleaning and structuring data for effective analysis. Efficient data preparation ensures that machine learning models perform accurately.
Big Data Technologies
As businesses generate vast amounts of data, working with big data technologies becomes essential. Data scientists often use distributed computing frameworks such as Hadoop, Spark, and Apache Kafka to process large datasets efficiently. Cloud computing platforms like AWS, Google Cloud, and Microsoft Azure also offer data science tools that facilitate large-scale analytics. Understanding these technologies allows data scientists to work with real-time and large-scale data environments.
Data Visualization and Storytelling
Even though data scientists build complex models, their findings must be communicated effectively. Data visualization is essential for interpreting and presenting insights. Proficiency in tools like Tableau, Power BI, and Python visualization libraries such as Matplotlib and Seaborn is necessary. Additionally, the ability to tell a compelling data-driven story helps stakeholders understand the impact of insights on business decisions.
SQL and Database Management
While programming and machine learning are important, SQL remains a fundamental skill for any data professional. Data scientists frequently work with structured databases, writing advanced queries to extract relevant data. Understanding indexing, joins, window functions, and stored procedures can enhance efficiency when dealing with relational databases like MySQL, PostgreSQL, or SQL Server.
Business Acumen and Problem-Solving
A successful data scientist must bridge the gap between technical expertise and business impact. Understanding industry-specific problems and applying data science techniques to solve them is key. Data scientists must be able to translate business problems into data-driven solutions, making business acumen an invaluable skill. Additionally, problem-solving skills help in selecting the right algorithms, optimizing models, and making data-driven recommendations.
Version Control and Deployment Skills
Data scientists not only build models but also deploy them into production. Learning version control systems like Git and GitHub helps in tracking code changes and collaborating with teams. Deploying machine learning models using tools like Flask, Docker, and Kubernetes ensures that models can be integrated into real-world applications. Understanding MLOps (Machine Learning Operations) can also enhance the ability to maintain and improve models post-deployment.
Continuous Learning and Experimentation
Data science is an evolving field, requiring continuous learning and adaptation to new technologies. Experimenting with new algorithms, participating in data science competitions like Kaggle, and keeping up with research papers can help stay ahead in the field. The ability to learn, experiment, and apply new techniques is crucial for long-term success.
Conclusion
The transition from data analyst to data scientist requires developing a robust skill set that includes programming, machine learning, statistical analysis, and business problem-solving. While data analysts already have experience working with data, advancing technical skills in Python, deep learning, and big data technologies is essential for stepping into data science. By continuously learning, working on real-world projects, and gaining hands-on experience, data analysts can successfully move into data science roles and contribute to solving complex business challenges with data-driven insights.
0 notes
Text

ARMxy RK3568B2 Industrial IoT Gateway TimescaleDB for Scalable SQL-based Time-Series Data
The ARMxy BL410 series is a versatile industrial ARM controller designed for flexible I/O configuration. It is based on the Rockchip RK3568J/RK3568B2 processor, featuring aquad-core ARM Cortex-A55 architecture with clock speed up to 1.8GHz/2.0GHz. The device is equipped with 8/16/32GB eMMC storage and various combinations of 1/2/4GB LPDDR4X RAM. Additionally, it includes a built-in 1TOPS computing power Neural Processing Unit (NPU) for supporting deep learning tasks.
The BL410 series ARM embedded computer offers a rich array of interfaces including
3 x 10/100M Ethernet ports, 2 x USB 2.0 ports, 1 x optional HDMI 2.0a port, 1 x optional X series IO board, 2 x optional Y series IO boards. These interfaces support various functions such as communication, PWM output, pulse counting, and data acquisition and control. The BL410 also supports hardware decoding of 1080P@60fps videos.
Additionally, it features a built-in Mini PCIe interface to support communication modules such as Bluetooth, WiFi, and 4G modules.
The BL410 series ARM embedded computers support Linux-4.19.232, Linux-RT-4.19.232 kernels, Debian-10.13, Android 13, Docker containers, Node-RED, and Qt-5.15.2 for graphical interface development tools. In addition, BL410 is compatible with BLIoTLink industrial protocol conversion software for data collection and transformation, and can seamlessintegration with various mainstream IoT cloud platforms and industrial SCADA software. Users can leverage the BLRAT for remote access and maintenance of the BL410 embedded computer. Additionally, with support for Node-Red, users can rapidly develop IoT applications on the BL410.
The BL410 series ARM embedded computer has undergone rigorous electrical performance design and high-low temperature testing to ensure stability and reliability. It is designed for DIN35 rail mounting, making it suitable for various industrial application environments.
This embedded computer is widely used in industrial IoT, photovoltaic power generation and energy storage systems, automation control, and transportation and rail applications.
0 notes